
The simplest change to improve your charts and spreadsheets is adjusting color contrast and font clarity. Use bold, contrasting colors like dark blue on yellow or black on white to make data stand out. Choose easy-to-read fonts such as Arial or Verdana, and set appropriate sizes to enhance readability. Structuring your visual hierarchy with clear font weights and sizes guides viewers naturally. Keep these tweaks in mind, and you’ll discover more ways to make your data even clearer.
Key Takeaways
- Increase contrast by choosing bold, contrasting colors for charts and spreadsheet elements.
- Use larger, clear fonts like Arial or Verdana for better readability.
- Apply a structured visual hierarchy with font size and weight to emphasize key data.
- Optimize color schemes to distinguish sections clearly, avoiding pastel or light shades on light backgrounds.
- Review visuals on different screens or print to ensure accessibility and clarity.

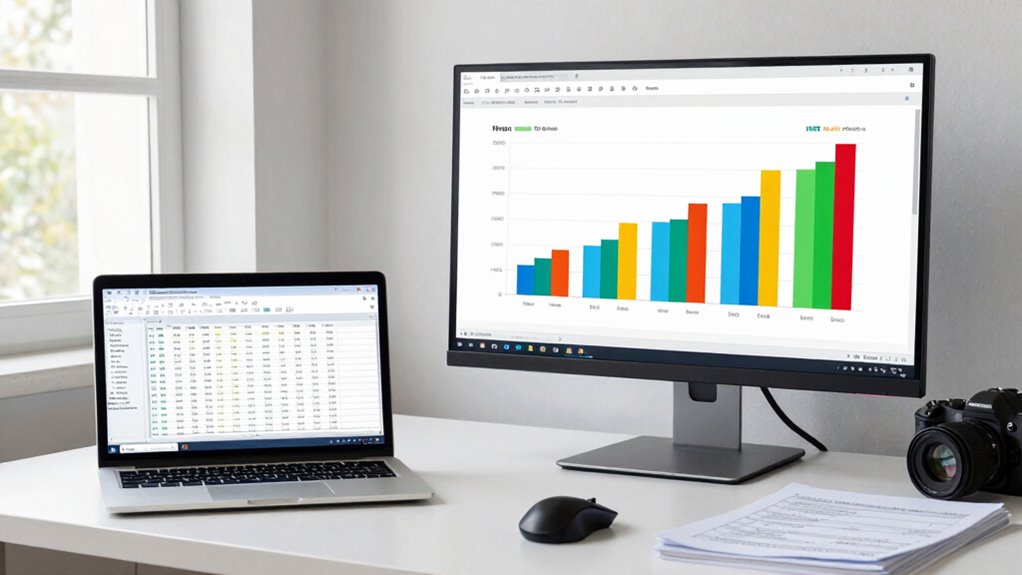
Creating clear and effective charts and spreadsheets often starts with a simple setup change that many overlook. That change involves paying close attention to color contrast and font clarity. When you focus on these elements, you make your data easier to read and interpret, which improves overall communication. It’s easy to get caught up in the data itself and forget that visual presentation plays a critical role in understanding. Small adjustments, like choosing contrasting colors and clear fonts, can make a significant difference. Paying attention to digital concepts such as visual hierarchy can help structure your data for better comprehension. Start with color contrast. If your chart or spreadsheet uses colors that are too similar, your viewers struggle to distinguish between different sections or data points. For example, pastel shades or light colors on a white background can blend together, making it hard to see where one section ends and another begins. Instead, opt for bold, contrasting colors—like dark blue against light yellow or black against white—to create visual separation. This ensures that each element stands out, guiding the viewer’s eye smoothly across the data. Using high-contrast color schemes enhances readability, especially for users with visual impairments or color vision deficiencies. Next, pay attention to font clarity. The font you choose should be easy to read at a glance. Avoid overly decorative or thin fonts that can become illegible when scaled down or viewed from a distance. Stick with clean, simple fonts like Arial, Calibri, or Verdana, which are designed for clarity. Make sure your font size is appropriate—large enough to read comfortably without overwhelming the chart or spreadsheet. Consistent font usage also helps maintain a professional appearance and prevents confusion. When you emphasize headers or important figures, use bold or slightly larger font sizes to draw attention without cluttering the overall layout. Combining good color contrast with clear fonts creates a visual hierarchy that guides your audience through the data naturally. You want your viewers to quickly grasp the main points without struggling to decipher text or interpret colors. Adjusting these settings is simple but impactful; it’s a quick tweak that can elevate your entire presentation. Before finalizing your charts or spreadsheets, take a moment to view them on different screens or in print to ensure the contrast and font clarity hold up across formats. Doing so confirms your data remains accessible and easy to understand, making your work more effective.
high contrast color pens for spreadsheets
As an affiliate, we earn on qualifying purchases.
As an affiliate, we earn on qualifying purchases.
Frequently Asked Questions
Can This Setup Change Improve Readability on Mobile Devices?
Yes, this setup change can improve readability on mobile devices. By enhancing mobile responsiveness and enabling font scaling, your charts and spreadsheets become easier to view and navigate on smaller screens. You’ll find that adjusting layout elements and text size helps prevent clutter and makes data more accessible. This simple tweak guarantees your content adapts seamlessly to various devices, providing a better user experience and reducing strain when viewing on mobile.
Does This Change Work With All Spreadsheet Software?
Yes, this change generally works with most spreadsheet software, enhancing chart accessibility and color customization. It allows you to adjust colors for better visibility, making charts easier to interpret on various devices. However, some programs may have limited options, so it’s good to verify your specific software’s features. Overall, this simple setup tweak improves usability and visual clarity across different platforms, benefiting your data presentation efforts.
Is There a Way to Customize Color Schemes Further?
Around 85% of spreadsheet users find customized color schemes helpful. Yes, you can further customize your color schemes by adjusting color contrast and creating custom palettes. Most spreadsheet software allows you to select specific shades or save color combinations for quick access. This way, you can enhance visual clarity, guarantee consistency, and make your charts and spreadsheets more visually appealing and easier to interpret.
How Does This Change Affect Printing Charts and Spreadsheets?
This change improves printing by enhancing color contrast, making charts and spreadsheets clearer on paper. You’ll notice better visibility of data and labels, even in black-and-white prints, thanks to optimized contrast settings. Additionally, it helps with print scaling, ensuring your charts fit well on pages without losing detail. Overall, this setup makes your printed materials more legible and professional, saving you time adjusting settings later.
Can This Setup Be Automated for Multiple Files?
Automation potential for this setup is high, making batch processing of multiple files straightforward. You can create macros or scripts that apply the setup change across several spreadsheets or charts at once. This saves time and guarantees consistency, especially when handling large volumes of data. While manual adjustments are tedious, leveraging automation tools simplifies the process, allowing you to efficiently implement the setup change across many files simultaneously.
Avery Printable Address Labels with Sure Feed, 1" x 2-5/8", Matte Clear, 300 Blank Mailing Labels (18660)
Create a Seamless Look: Frosted clear labels blend beautifully on white and light-colored envelopes, vellum, glassine, frosted glass,…
As an affiliate, we earn on qualifying purchases.
As an affiliate, we earn on qualifying purchases.
Conclusion
By making this simple setup change, you can instantly improve the clarity of your charts and spreadsheets. It’s a quick tweak that enhances visibility and reduces eye strain, especially during long work sessions. Did you know that over 60% of professionals report better focus and productivity after optimizing their display settings? Small adjustments like this can have a big impact on your efficiency. So, give it a try and see how much easier your data becomes to interpret!

Pemberly Row 36"x60" Enclosed Letterboard, Black Vinyl Panel, Silver Aluminum Frame, Weather-Resistant with Locking Doors, Includes 327-Piece Gothic Font Letter Set, Indoor/Outdoor Presentation Board
Finish: Black
As an affiliate, we earn on qualifying purchases.
As an affiliate, we earn on qualifying purchases.
visual hierarchy spreadsheet templates
As an affiliate, we earn on qualifying purchases.
As an affiliate, we earn on qualifying purchases.